
Official Research Report DesignCover Design // Layout Design // Infographic Design // Data Visualization // Image EditingResearch Report Design
Client: Singapore Productivity Centre SGPC
Title: Singapore Food Services Productivity Benchmarking Report (2024/2025)

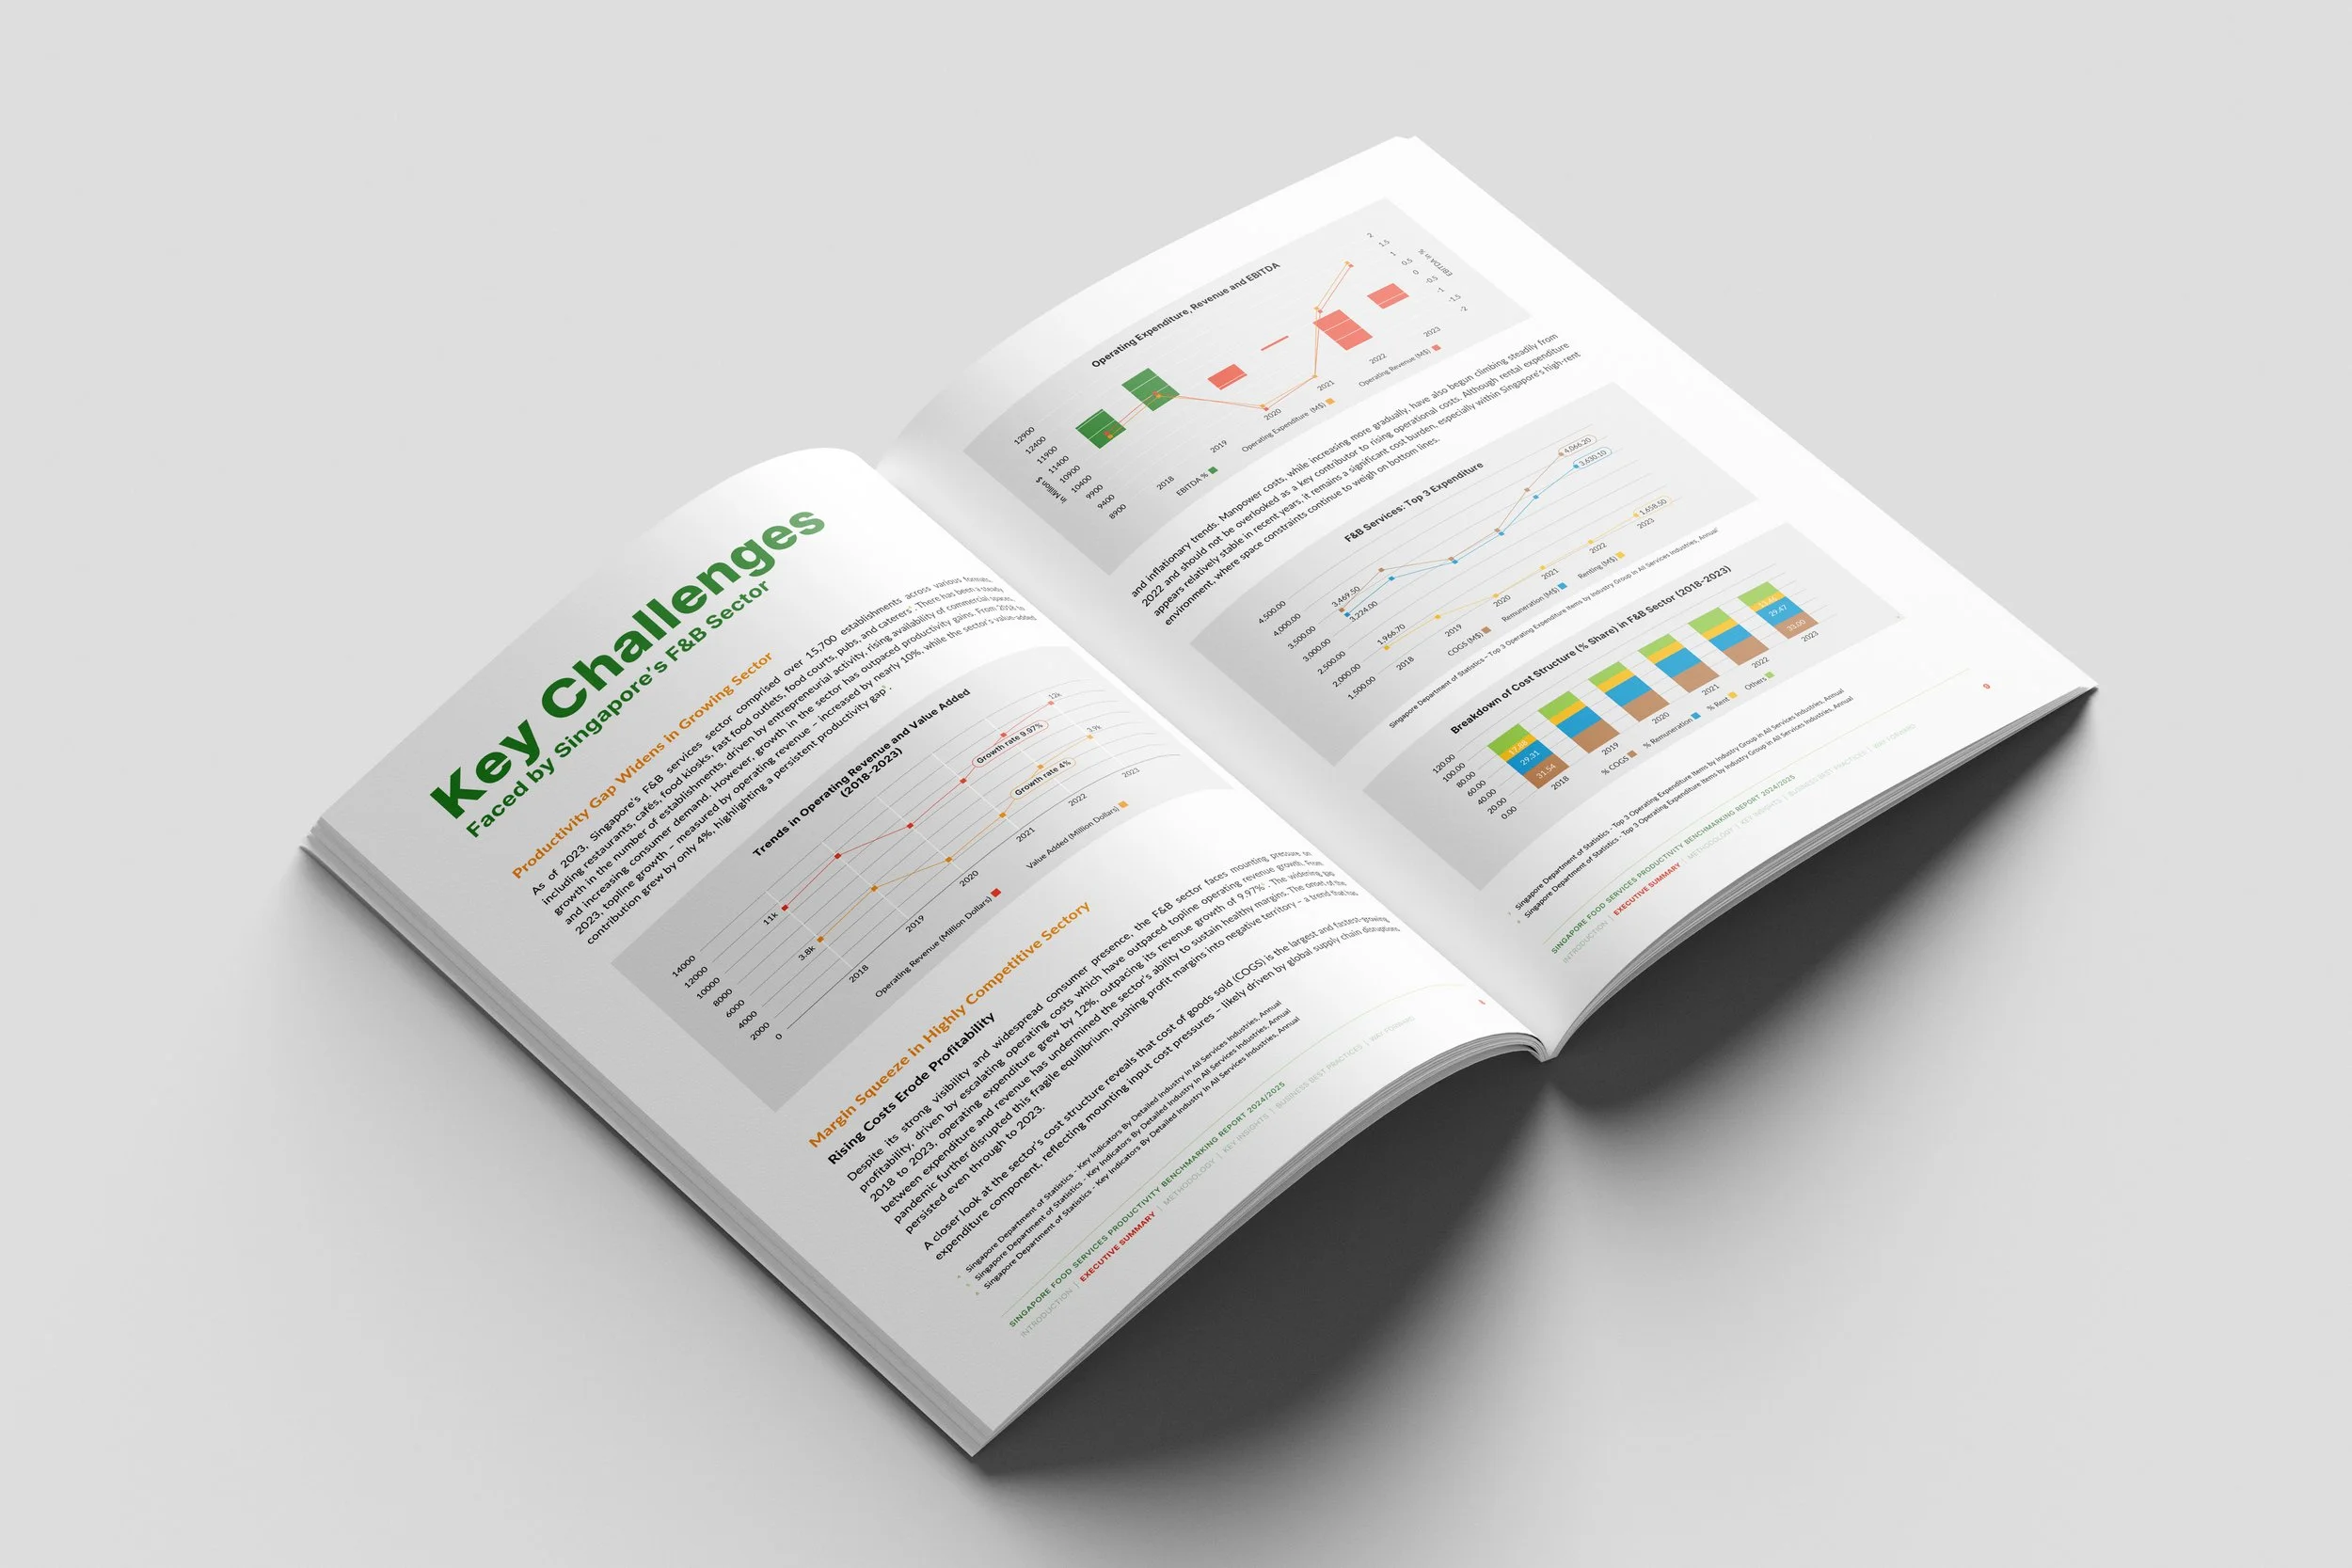
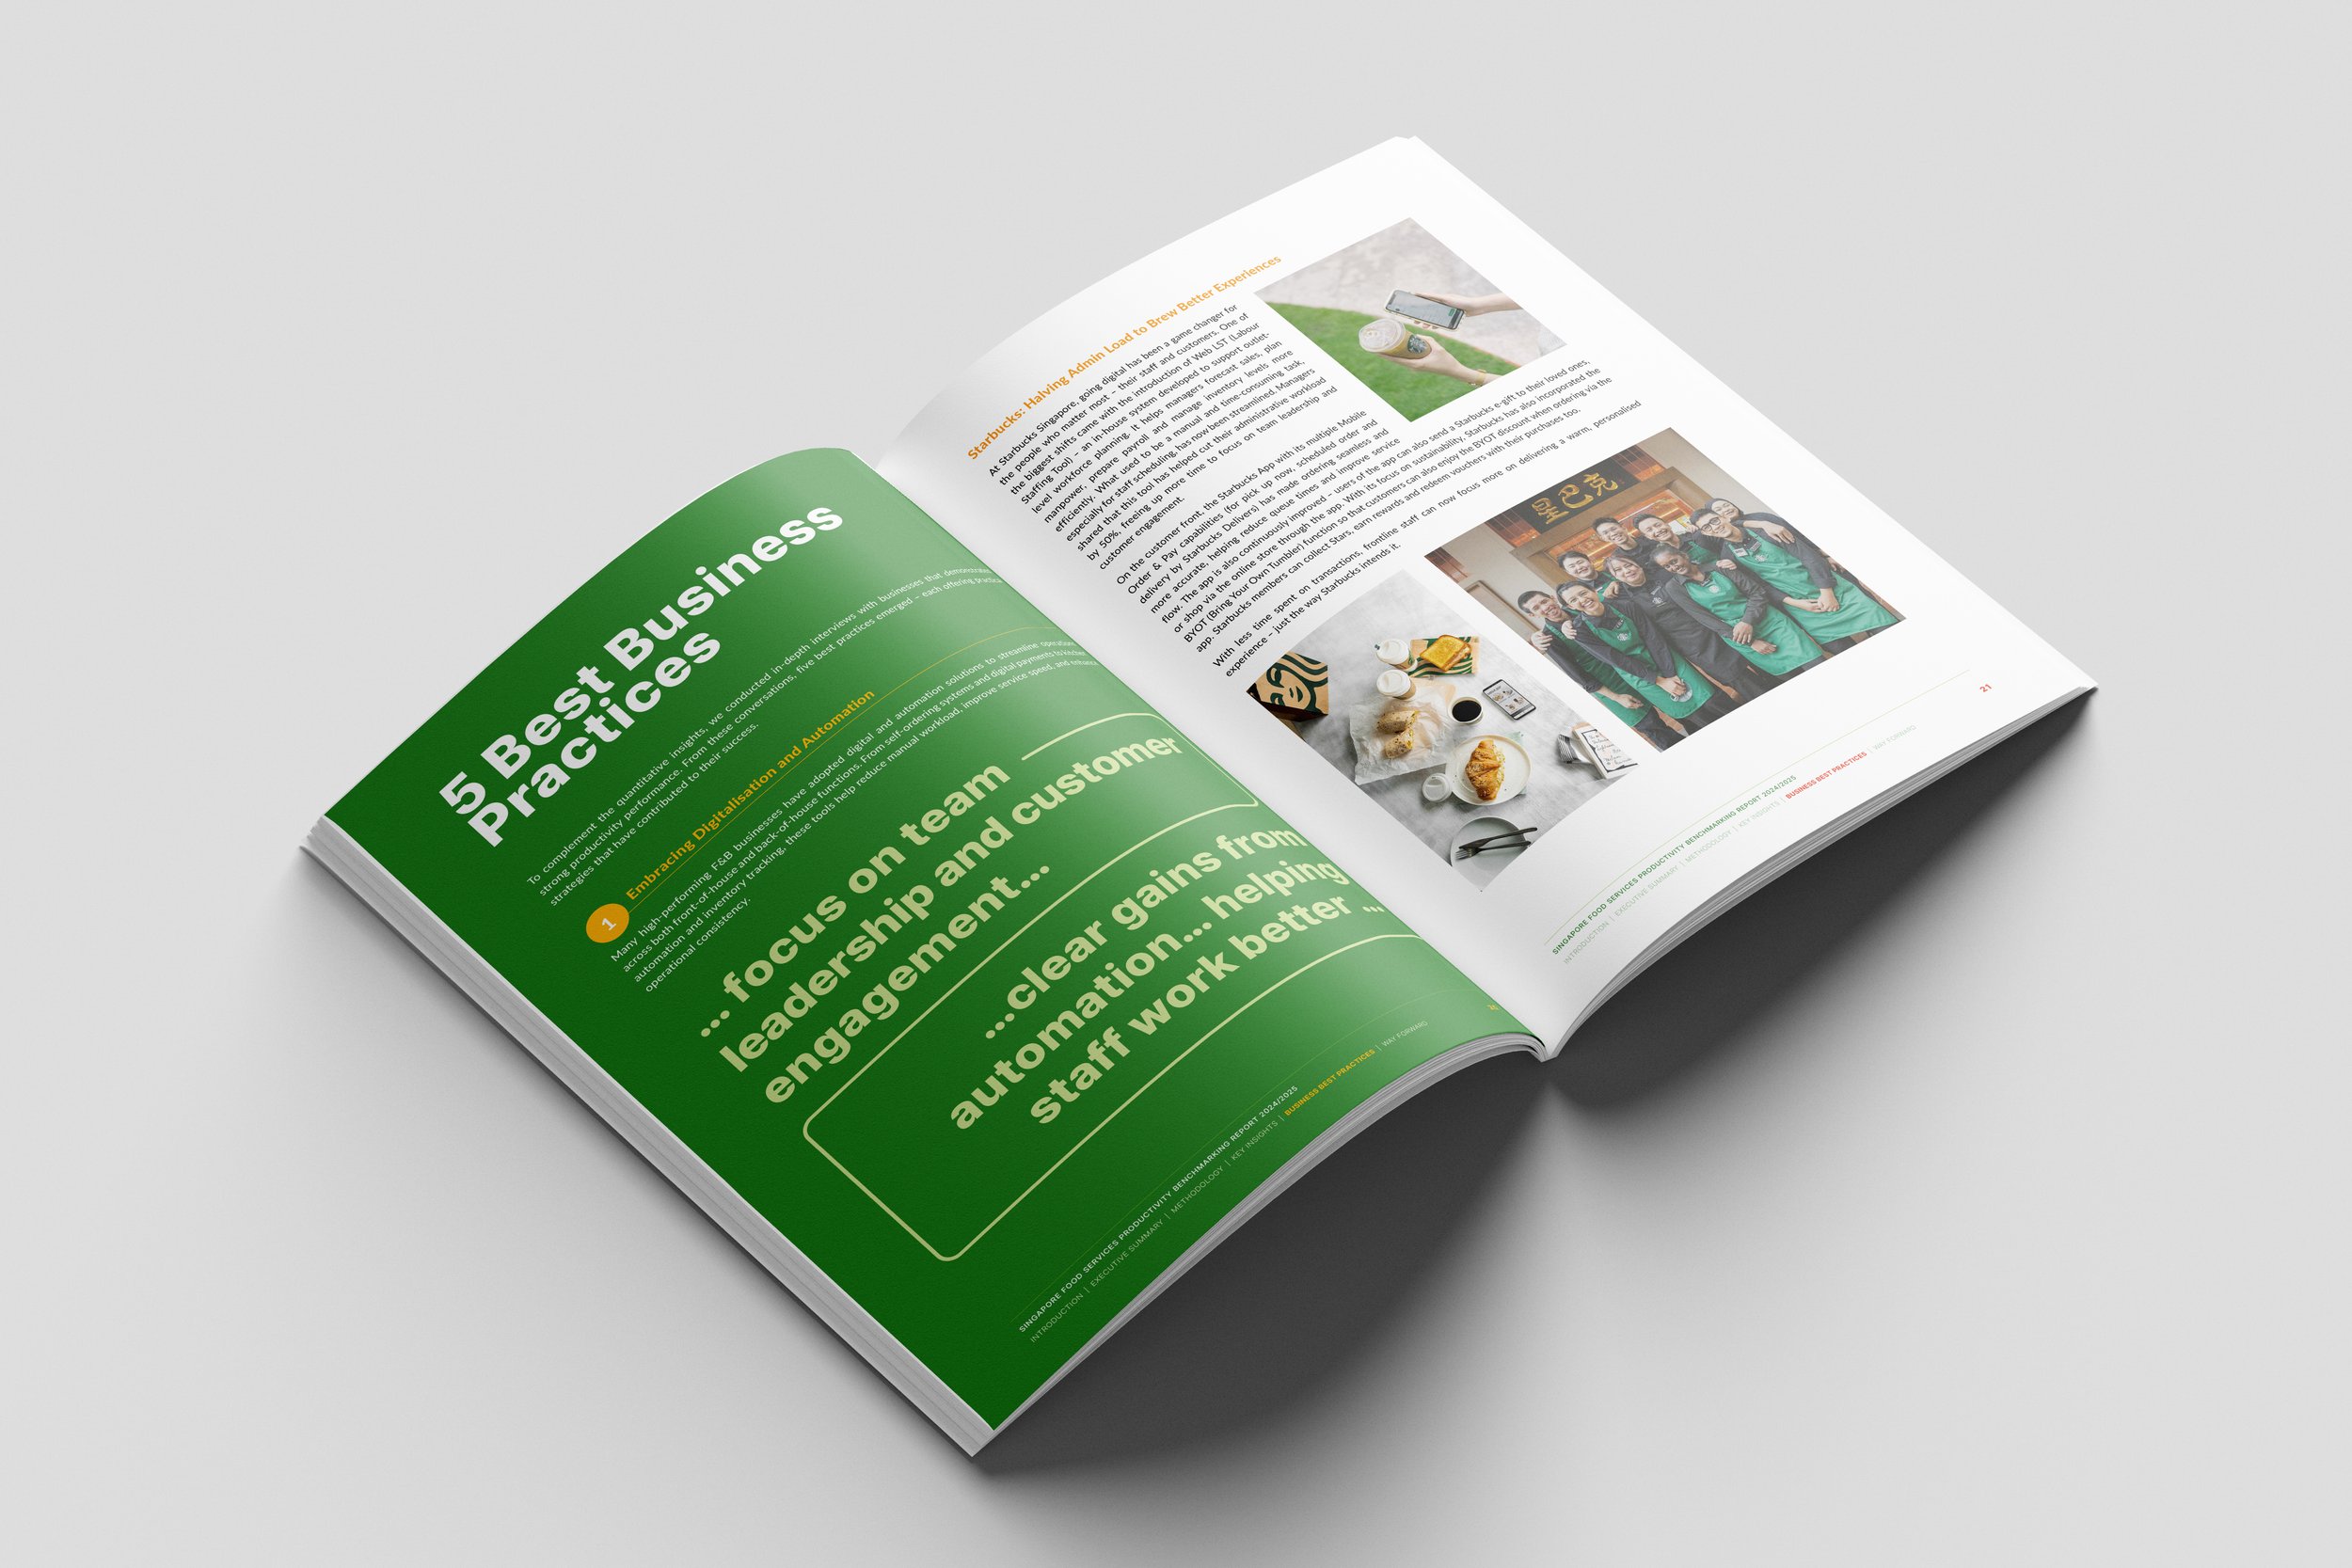
For the Singapore Food Services Productivity Benchmarking Report, my goal was to create a design that feels vibrant, professional, and locally resonant. Industry reports often suffer from dense data and dry layouts, so I balanced data density with visual storytelling.
By combining flat vector illustrations on the cover with structured, colorful data layouts inside, the publication invites readers in while making complex economic metrics effortless to parse.
Color Palette & Brand Consistency
To maintain visual harmony throughout the publication, I used a vibrant color palette inspired by productivity and growth.
Structured Data & Editorial Layout
Inside the report, I focused on high readability and visual hierarchy to transform complex analytical data into clear insights:
Section Divider Pages: Bold, full-color section headers create distinct visual breaks in the report, allowing readers to orient themselves quickly.
Data Visualization & Charts: Financial charts, bar graphs, and line graphs are styled using consistent color blocks (orange, green, blue) on light gray background panels. This isolates the charts visually, making trend lines and performance comparisons easy to scan.
Editorial Case Studies: For best-practice pages, I incorporated real-world imagery alongside structured body copy to balance data charts with practical, human-centered industry stories.
Key Design Strategies & Solutions:
Contextual Storytelling on the Cover
The cover illustration uses a layered, narrative structure to tell the story of Singapore’s Food Services sector at a glance:
Top Layer (Singapore Skyline): Features iconic landmarks like Marina Bay Sands and the Singapore Flyer, establishing immediate local context and national economic relevance.
Middle Layer (Kitchen Operations): Displays back-of-house kitchen staff and chefs at work, emphasizing operational efficiency, food prep, and kitchen technology.
Bottom Layer (Dining Experience): Illustrates front-of-house service, customer interaction, and restaurant ambiance.
This three-tiered visual hierarchy connects Singapore's broader economy directly to the day-to-day operations of the food and beverage industry.